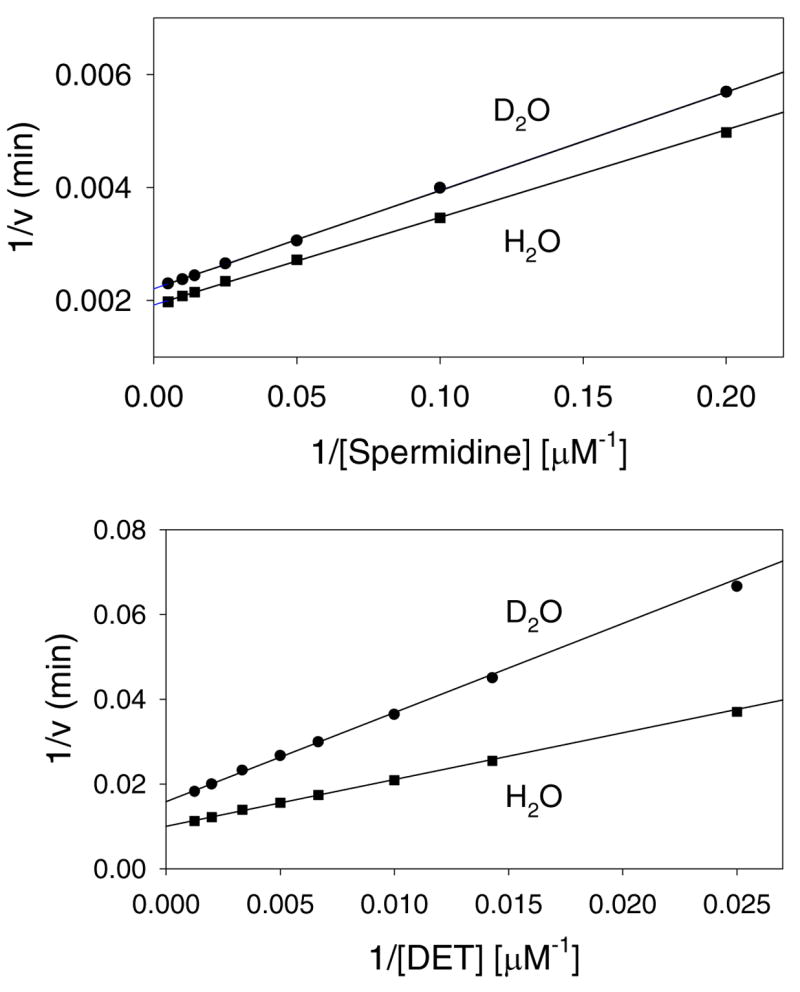
Figure 3. Solvent kinetic isotope effect for hSSAT.

The symbols are experimentally determined values in H2O (■) or 99% D2O (●); the lines are fits of the data to Equation 6. Spermidine and DET were variable substrates at a fixed, saturating concentration of AcCoA.
