
Figure 6.
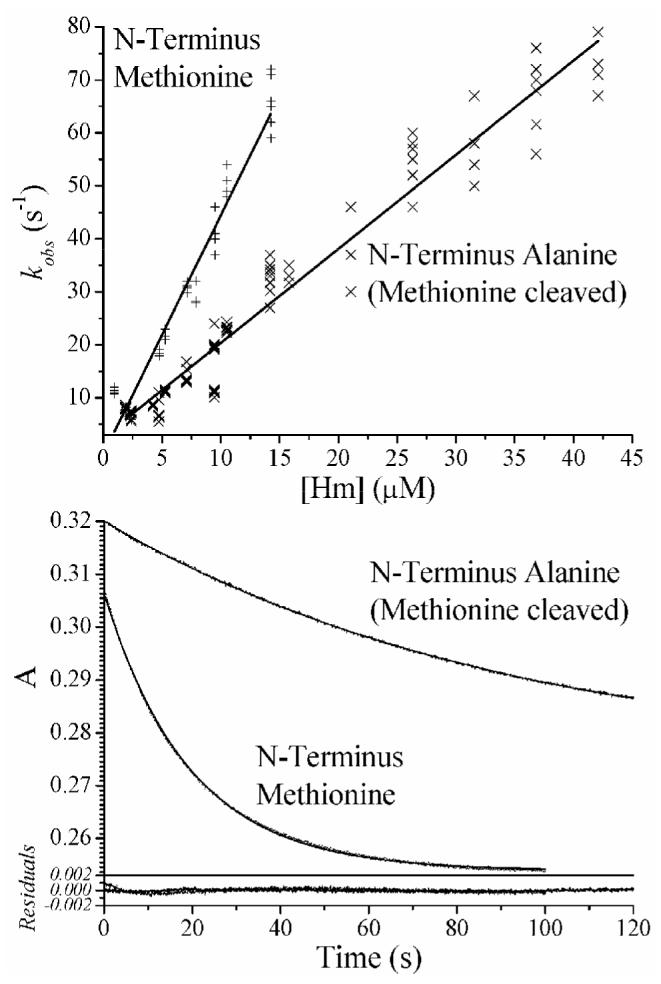
Example of stopped-flow kinetics measurements on the histamine complex of NP2-D1A (x) and NP2-M0D1 (+) at pH 7.5. Top: Plot of kobs values obtained from first order fits of a number of histamine binding reactions at various histamine concentrations, fit with a straight line to obtain kon from the slope. Bottom: Plot of absorbance change with time of a histamine displacement reaction, fit with a first order decay (with associated residuals shown) to obtain koff.