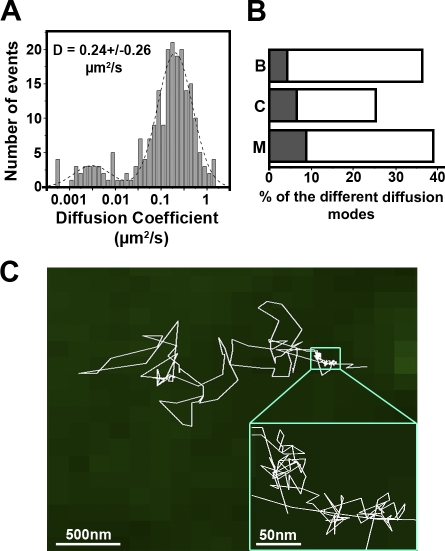
Figure 3.
Single-molecule analysis of CD55 in PC3/CD9 cells. (A) ADC distribution and mean value (±SD) of CD55 molecules labeled with Atto647N-conjugated mAb 12A12. D is the mean value of the ADC calculated from a linear fit of the MSD-τ plot, and the dashed line delineates two different populations corresponding to pure confined trajectories (lower ADC) or mixed and Brownian trajectories. (B) Histograms (open boxes) representing the percentage of each CD55 diffusion mode as compared with the total number of trajectories. The gray part corresponds to the proportion of trajectories associated with TEAs (identified with the ensemble membrane labeling) for each diffusion mode (B, Brownian; C, confined; M, mixed). Compare with Fig. 2 D. (C) Trajectories of a single CD55 molecule. The inset is a magnification of the transient confinement area delineated by the boxed area.

