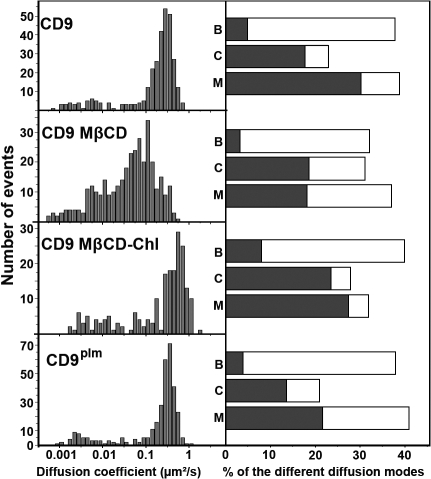
Figure 5.
Distribution of the ADC and diffusion modes of CD9 and CD9plm and their partitioning in tetraspanin-enriched compartments. (left) ADC distribution of CD9 in control cells (CD9), cells treated with MβCD (CD9 MβCD), cells treated with MβCD loaded with Chl (CD9 MβCD–Chl), or cells transfected with nonpalmitoylated CD9 (CD9plm). 50% of the membrane Chl was removed by MβCD treatment, and MβCD–Chl treatment increased the Chl content to 130% as compared with control cells. All of the palmitoylation sites have been mutated in CD9plm cells. (right) Histograms (open boxes) representing the percentage of each diffusion mode of the molecules as compared with the total number of trajectories (B, Brownian; C, confined; M, mixed). The gray part corresponds to the proportion of trajectories associated with TEAs (identified with the ensemble membrane labeling) for each diffusion mode.

