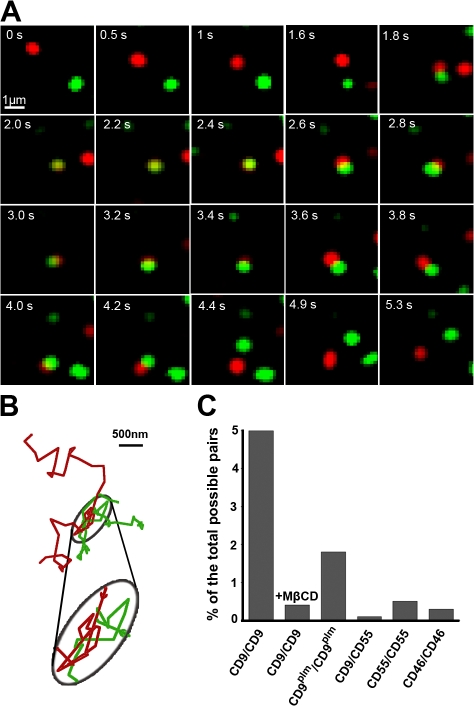
Figure 6.
Real-time dynamic observation of CD9 colocalization. (A) Time lapse showing a simultaneous single-molecule tracking of two differentially labeled CD9 molecules with a Fab fragment conjugated with Atto647N (red) or with Cy3B (green); see Video 2 (available at http://www.jcb.org/cgi/content/full/jcb.200803010/DC1). (B) Representative trajectory of CD9 dynamic colocalization. The parts of trajectories where the fluorescence signal of two particles overlap at least for one pixel (160 nm) are encircled in gray and magnified in the ellipse underneath (colored arrows indicate the trajectory direction). (C) Quantitative analysis of single-molecule colocalization. Two particles were considered spatially colocalized when at least one pixel of their fluorescence signals was overlapped during at least seven frames corresponding to 700 ms (the two molecules were colocalized during 24 frames in the time lapse shown in A). Different combinations of proteins were tested: CD9/CD9 on cells treated or not treated with MβCD, CD9plm/CD9plm, and irrelevant pairs such as CD9/CD55, CD55/CD55, and CD46/CD46.

