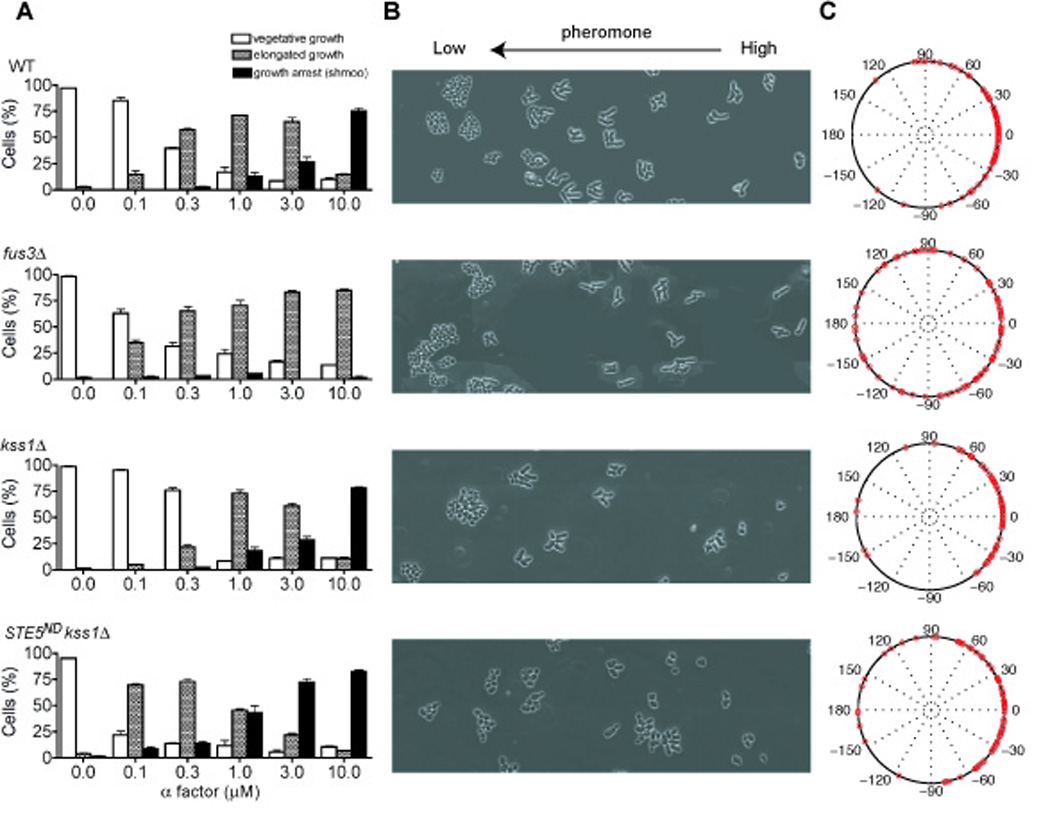
Fig. 2. Experimental measurements of yeast cell differentiation.

(A) Cell morphologies classified as: vegetative-growth, elongated-growth (length:width ≥1.6), or shmoo. Wild-type and mutant cells exposed to a uniform concentration of pheromone exhibit each of the three morphologies. (B) Cells exposed to a linear gradient of pheromone exhibit the three morphologies depending on their position within the chamber. Cell differentiation was recorded at 600 min for 3 independent experiments. (C) Chemotropic-growth quantified as the angle of cell projections and the direction of the gradient, represented with polar plots. Error bars, +/− standard error of the mean.
