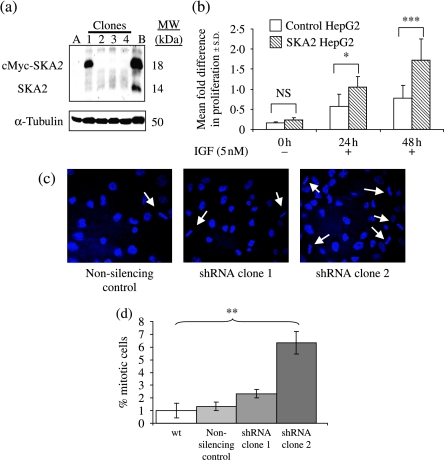
Figure 8.
SKA2 affects cell proliferation and mitosis. (a) Western blot showing stable expression of cMyc-SKA2 in HepG2 cells. SKA2-null HepG2 cells were transfected with cMyc-SKA2, clones were selected using neomycin and screened for cMyc-SKA2 expression by immunoblot. Clones 1–4 are presented; clone 1 expressed SKA2. A, parental HepG2 cells; B, HEK293 cells transiently transfected with cMyc-SKA2. Migration of the endogenous SKA2 in HEK cells and the transgenic myc-tagged SKA2 is marked. (b) MTT cell proliferation assay. Cells from clone 1 and non-expressing clone 4 were serum starved for 24 h before treatment with 5 nM IGF-I in triplicate. Cells were assayed after both 24 and 48 h. Statistical analysis used ANOVA followed by Tukey–Kramer post hoc test, *P=0·02, ***P=0·0001. Results are representative of two experiments. (c) Mitotic figures. A549 clones expressing shRNA to SKA2 and non-silencing control were grown overnight on coverslips and mounted in DAPI-containing mounting medium; arrows indicate mitotic cells. (d) Quantification of mitotic figures. The percentage of cells undergoing mitosis was calculated from a field of 100 cells. Graph shows average of three separate counts±s.e.m; t-test was used with Bonferroni correction for multiple comparisons. Wild-type compared with clone 2, **P=0·021; other comparisons with wild-type were non-significant.

