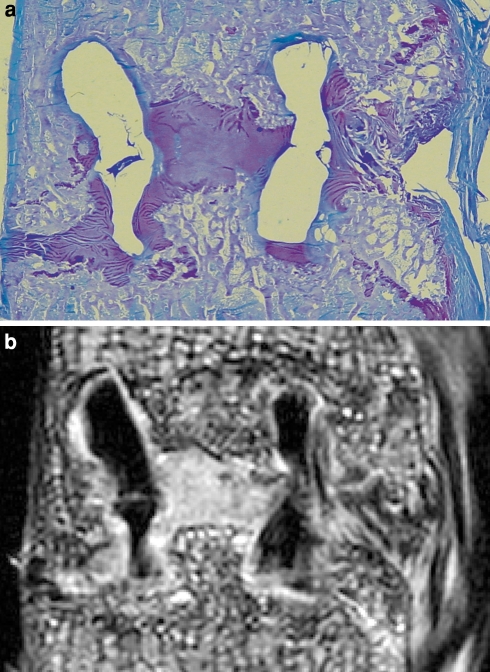
Fig. 1.
a Micrograph of a toluidine blue stained specimen of a fused segment after 6 months. Encircled are several ROIs identifying different types of tissue involved in the spinal fusion. b The corresponding micro-MRI image. In the designated ROIs the average signal intensity was determined using image analysis software. Note the low signal intensity of the cage material, the deformation and the cracks

