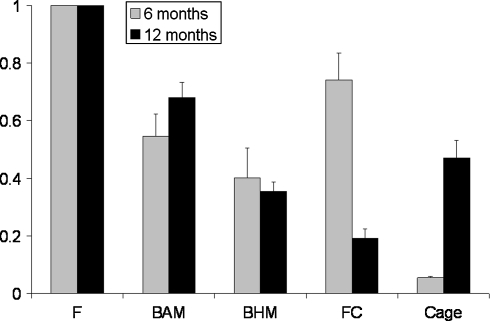
Fig. 2.
The ratios of the different tissues analyzed in the present study (±SEM). The signal intensity of fibrous tissue is used as a standard (1 by definition). All other tissues are expressed as a ratio of fibrous tissue. Fibrocartilage and cage material signal intensities both changed during the follow-up. *p < 0.05 as compared between follow-up time-points (Student t test)

