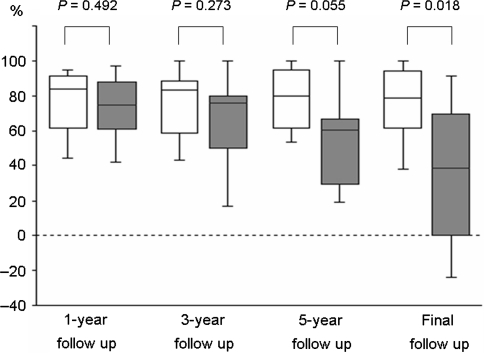
Fig. 3.
Box plots showing the time-course changes in percent recovery (%) in the union and the nonunion groups. Patients who underwent revision surgery were excluded. Open boxes, union group (n = 30); filled boxes, nonunion group (n = 10). These plots illustrate the mean value as a horizontal line in a box. The vertical limits of the box define the 25th and 75th percentiles, and the error bars denote the 10th and 90th percentiles. The P values were calculated by using the Mann–Whitney test

