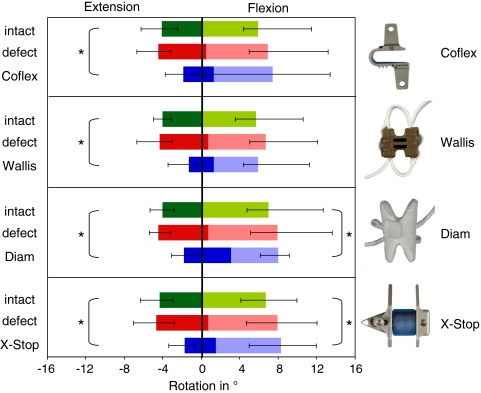
Fig. 3.
Range of motion (ROM) in flexion and extension for the intact, the defect condition and after implantation. Values are median with minimum and maximum.*P < 0.05 for comparisons between implanted and intact condition in each of the four groups (Wilcoxon signed rank test). The border between the light and the darkbars represents the median segmental tilt caused by defect (red) and by implantation (blue)

