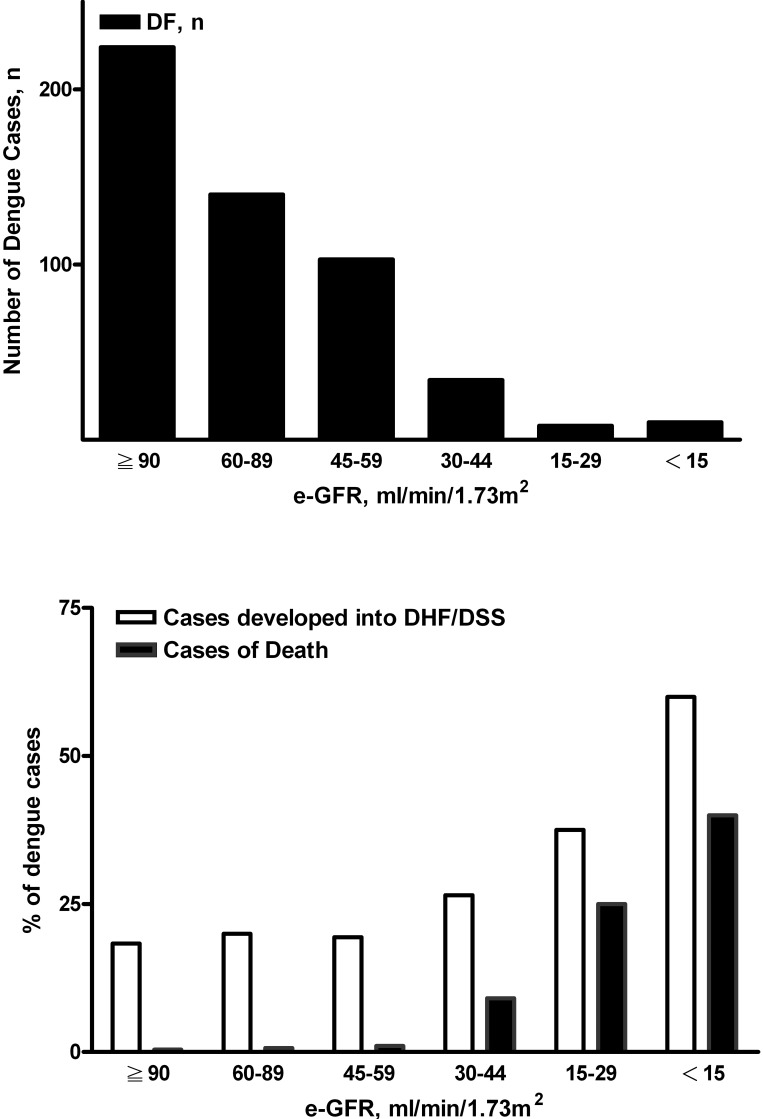
Figure 2.
Case distributions in different grades of estimated GFR (eGFR; top). The percentages of DHF/DSS and mortality in groups on the basis of different grades of eGFR are parallel to the severity of RF (bottom). Patients with more severe renal function impairment had higher percentages of DHF/DSS (P = 0.029) and mortality (P < 0.001) by χ2 test for linear trend. eGFR calculated by simplified Modification of Diet in Renal Disease (MDRD) equation.

