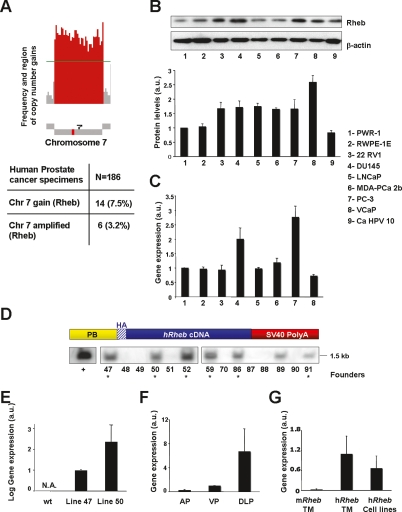
Figure 1.
Overexpression of Rheb in human prostate cancer and generation of the PB-Rheb mouse model. (A, top panel) Schematic representation of copy number gain in chromosome 7 harboring Rheb. Red bars represent the frequency of regions gained on chromosome 7. (Bottom panel) Frequency of human prostate cancer specimens that show single copy number gain and amplification of chromosome 7. (B) Western blot analysis of Rheb in a panel of human prostate cell lines. Rheb levels are normalized to actin. (a.u.) Arbitrary units. Error bars show SD from three independent experiments. (C) Quantitative RT–PCR analysis of the RNA from the same prostate cell lines (except for 9) showed in B with a human Rheb-specific probe. Error bars show SD from three independent experiments. (D, top panel) Schematic representation of the transgenic construct. (Bottom panel) Southern blot analysis of genomic DNA from founder animals. As a control (+) we used the vector harboring the transgenic construct digested as the genomic DNA from the tails. (E) Quantitative RT–PCR analysis of the prostate mRNA from PB-Rheb mice with a human Rheb-specific probe. N.A. stands for not amplified. Error bars show SD from three independent experiments. (F) Differential expression of transgenic human Rheb in the three lobes of the prostate of wild-type and PB-Rheb mice analyzed by quantitative RT–PCR. (AP) Anterior prostate; (VP) ventral prostate; (DLP) dorsolateral prostate. Error bars show SD from three independent experiments. (G) Level of endogenous murine Rheb in the prostate of PB-Rheb transgenic mice (TM) and human Rheb in the prostate cell lines showed in C, normalized to the level of human transgenic Rheb in TM analyzed by quantitative RT–PCR. Error bars show SD from three independent experiments.

