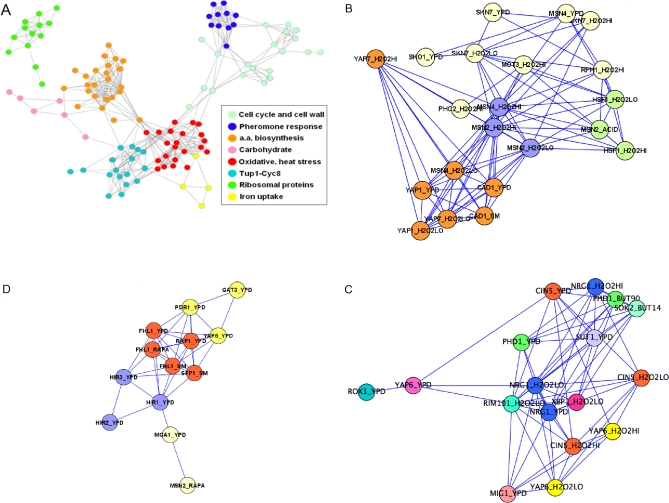
Figure 5. Co-modulation networks derived from inferred TF activity profiles.
(A) The network obtained by connecting all ChIP-based regulons whose t-profiles across the 936 conditions in our database are strongly correlated (r>0.5). To visualize the network, we applied the yFiles organic layout setting of Cytoscape [56]. Colors represent functionally related transcription factors (see legend). Eight separate sub-networks can be distinguished. (B) The oxidative and heat stress sub-network. In the label of each node, the condition used in the ChIP-chip experiment on which each regulon is based [7], is indicated in addition to the name of the TF. The color-coding is as follows. In green: regulons that mainly contain heat stress genes; in orange: regulons that mainly contain oxidative stress genes; the Msn2/4 ChIP- based regulons (blue) interconnect both; in purple: the Skn7 regulons; the regulons shown in yellow do not have a clear functional bias. (C) The “Tup1p-Cyc8p” sub-network (lower left cluster in Figure 4), in which TFs that rely on this co-repressor to control their transcriptional targets are connected. (D) The “ribosomal protein” sub-network (upper left cluster in Figure 4). The histone-regulating factors Hir1p/Hir2p/Hir3p are connected to the ribosomal protein-regulating factors Rap1p-Fhl1p-Sfp1p. In (b) and (c), similar colors again represent similar biological function.

