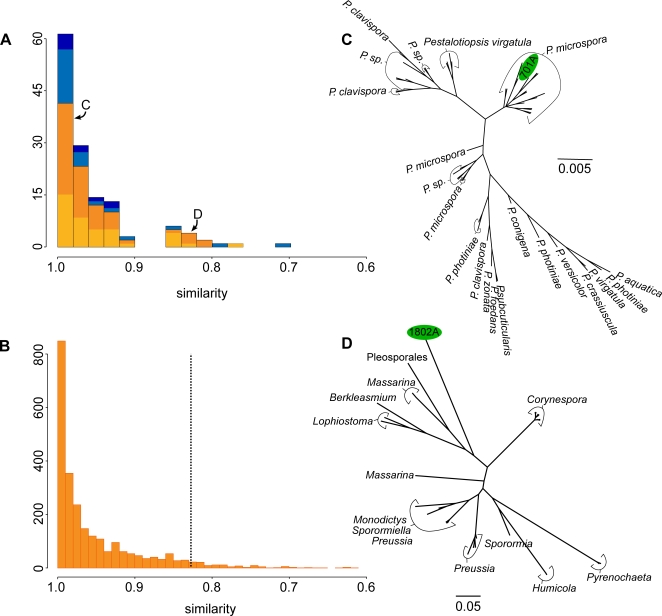
Figure 1. Endophytes diversity and GenBank.
(A) The distribution of pairwise nrDNA ITS similarities between each cultured endophyte and its closest identified match in GenBank. The orange portions represent those identified as ascomycetes; blue portions represent other fungal and bacterial lineages. Lightened orange and blue portions indicate the proportion of endophytes identified as bioactive. “C” and “D” mark the positions of the sequences included in the trees in Figs. 1C and 1D. (B) The distribution of pairwise nrDNA ITS similarities for each ascomycete sequence in GenBank and its closest match in GenBank; those to the right of the dotted line fall in the top 5% of most divergent sequences. (C)&(D) Example of the phylogenetic position and evolutionary distances to the 40 most similar nrITS sequences in GenBank of two bioactive Peruvian ascomycete endophytes (cultures P701a and P1802a, in green).

