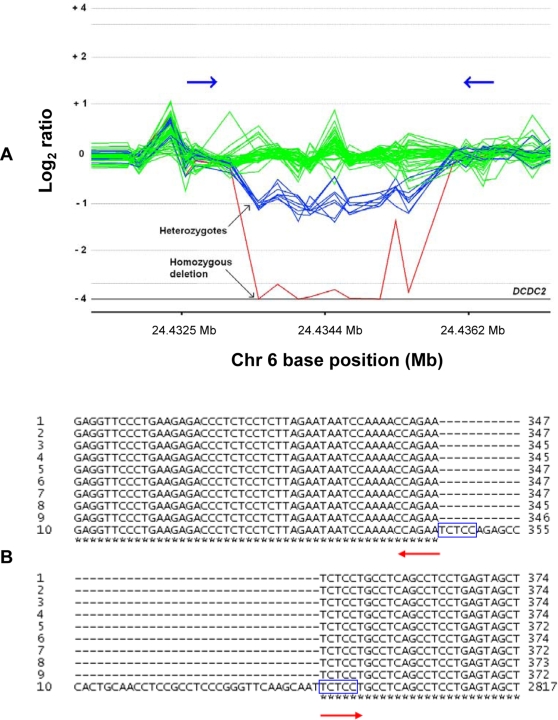
Figure 1. Example of deletion within DCDC2 gene having identical sequence breakpoints in 9 samples (representing 10 chromosomes).
A: CGH Analytics view of deletion detected by 9 consecutive probes within intronic region of gene DCDC2 at chr6: 24,433,346–24,435,791 (UCSC March 2006). The superimposed log2 ratios for the 50 samples are plotted as a function of chromosomal position and with different colours for putatively different copy number states (undeleted samples = green, putative heterozygous deletion samples = blue, and the putative homozygous deletion sample = red). Log2 ratios for 8 samples are around −1 (putative heterozygous deletion compared to the reference sample) and log2 ratio for one sample is around −4 (putative homozygous deletion). Blue arrows indicate approximate position of PCR primers. B: Multiple sequence alignment (using ClustalW) of 9 deleted samples (rows 1–9) with reference genome sequence (row 10). Asterisks indicate where all 10 sequences are perfectly aligned around the deleted region; upstream and downstream deletion breakpoints are indicated by the red arrows. The deleted region begins 345 bp into the reference sequence, and ends at 2790 bp, thus the deletion size is 2446 bp in all 9 samples. Blue boxes indicate 5 bp sequences of microhomology between the upstream and downstream breakpoints.

