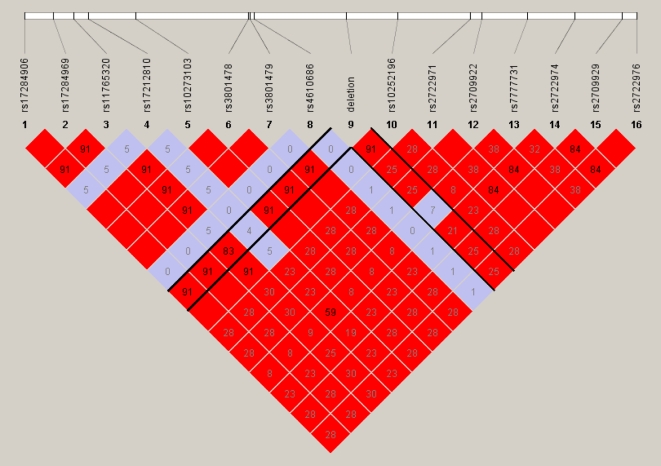
Figure 5. Zoomed in LD plot of deletion on chromosome 7: 82,856,584–82, 857,509, showing the 27 Kb haplotype block containing the deletion.
The Haploview default colouring scheme is used: positions are white if LOD <2 and D' <1; blue if LOD <2 and D' = 1; shades of red as a function of D' if LOD ≥2; bright red if D' = 1 and LOD ≥2. Numbers within boxes refer to the r2 values between two given positions, so are not directly connected to the colouring scheme. Solid black lines delineate LD between the deletion and other markers in this region. This deletion is in a block of strong LD, and has high LD to all positions in this block (see Figure S5-j for full LD plot).

