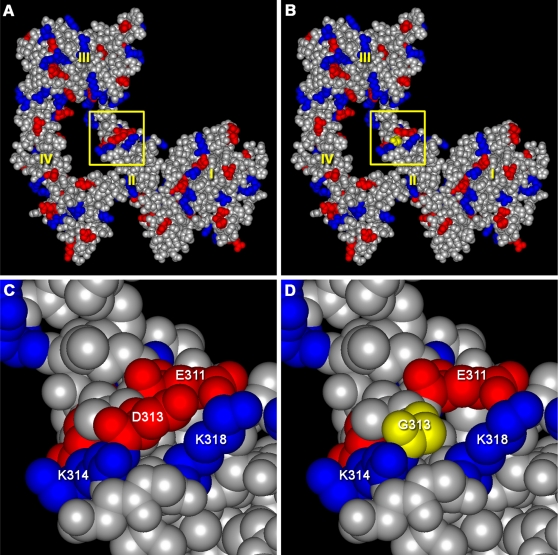
Figure 5. Modeling the msp1 Mutation.
Structural models of mouse wild type (A) and msp1-mutant (B) ERBB3 extracellular domains in the “closed” conformation. Negatively charged residues are shown in red, while positively charged residues are marked in blue. Protein domains I, II, III, and IV are labeled in yellow. The region of the msp1 mutation (yellow square) is located in domain II. C and D show close-up views of the regions denoted by the yellow squares in panels A and B. The msp1 mutation results in the loss of negative charge on the surface of the molecule. The bulky, negatively charged aspartic acid in the wild type protein is shown in red in panel C. This aspartic acid was replaced by glycine (a small, non-polar amino acid), shown in yellow in panel D.

