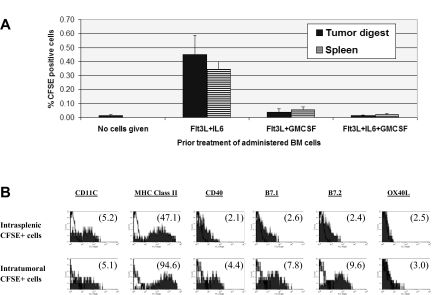
Figure 5.
In vivo fate of BM cells administered following step 1 conditioning treatments. Eighteen million BM cells were labelled with CFSE and given by tail vein to mice bearing 10-day MCA-203 subcutaneous tumors. Forty-eight hours later, mice were euthanized and single cell suspensions of tumors and spleens processed for FACS analyses. (A) Frequency of CFSE+ cells recovered in tumor or spleen. Each bar shows average of 5 synchronously analyzed tumors or spleens (± SD) in a single experiment for each step 1 condition or for background staining (no cells given). Flt3L + IL-6 versus Flt3L + GMCSF or Flt3L + IL-6 + GMCSF conditioning, P < .001. (B) Phenotype of CFSE+ cells re-covered in tumor or spleen following in vitro Flt3L + IL-6 conditioning. Numbers in parentheses in each histogram display mean fluorescence specificity indices. Results in panels A and B are representative of 3 separate experiments.

