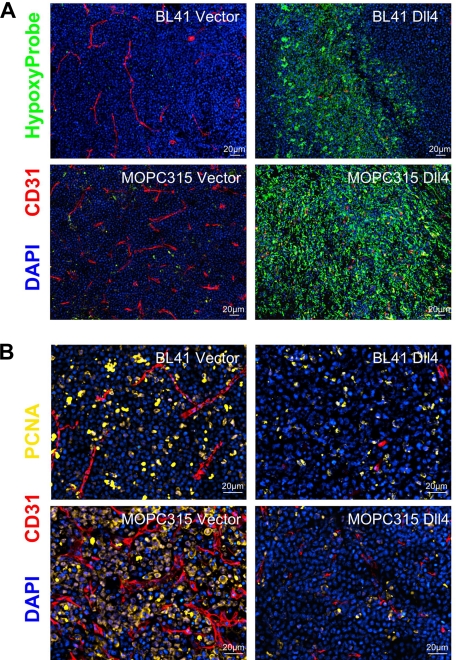
Figure 5.
Hypoxia and proliferative rate in Dll4 and control tumors. (A) Control BL41 and MOPC315 tumors display little hypoxia whereas Dll4-BL41 and Dll4-MOPC315 tumors display prominent hypoxia (HypoxyProbe, green). (B) PCNA immunostaining (yellow) shows reduced proliferation rates in Dll4-BL41 and Dll4-MOPC315 tumors compared with BL41 and MOPC315 controls. Tumor vessels (red, CD31 immunostaining) and nuclei (blue, DAPI) are also shown.

