
Figure 7.
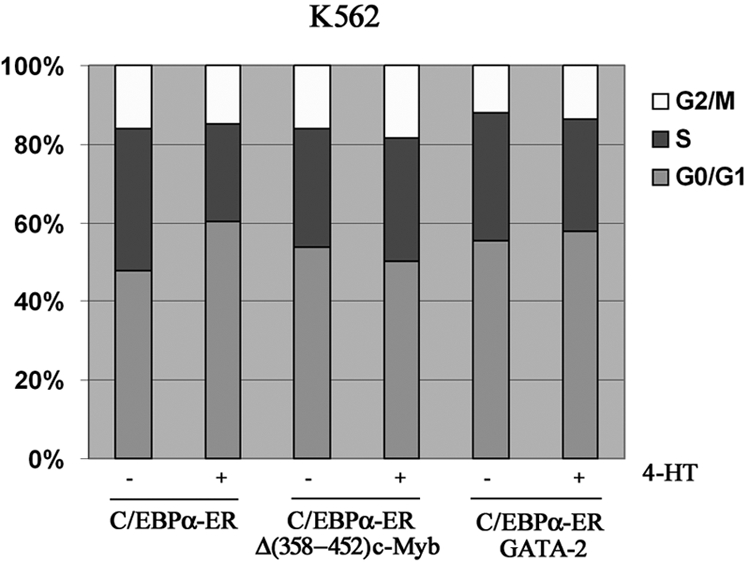
Cell-cycle distribution of K562-C/EBPα-ER, K562-C/EBPα-ER-Myb, and GATA-2/K562-C/EBPα-ER cells. Histogram shows cell-cycle distribution (DNA content of propidium iodide–stained nuclei) of untreated and 4-HT–treated cells. Representative of 2 experiments.