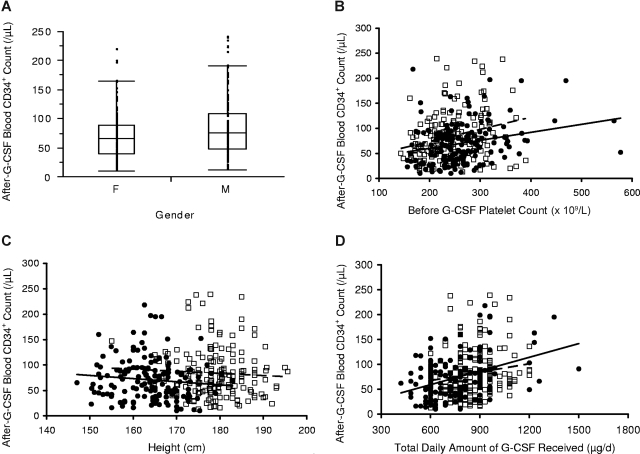
Figure 5.
Peripheral blood peak CD34+ cell count in male (□, dashed trend line) and female (●, solid trend line) white donors after 10 μg/kg per day G-CSF according to pre G-CSF platelet count, height, and total amount of G-CSF received. As shown in panel A, white females (F) had lower mean post–G-CSF CD34+ cell counts than males (M; mean, 69 vs 83/μL, P = .007; median, 66 vs 76/μL). The horizontal line represents the median, the box the 25th percentile, and the whiskers the 75th percentile. Female donors also had lower CD34+ responses than male donors when plotted against the pre–G-CSF platelet count (B) and height (C); these associations were mitigated by the fact that, on average, women had higher pre–G-CSF platelet counts and lower height than men. When plotted against total G-CSF received, CD34+ responses were similar in men and women (D).

