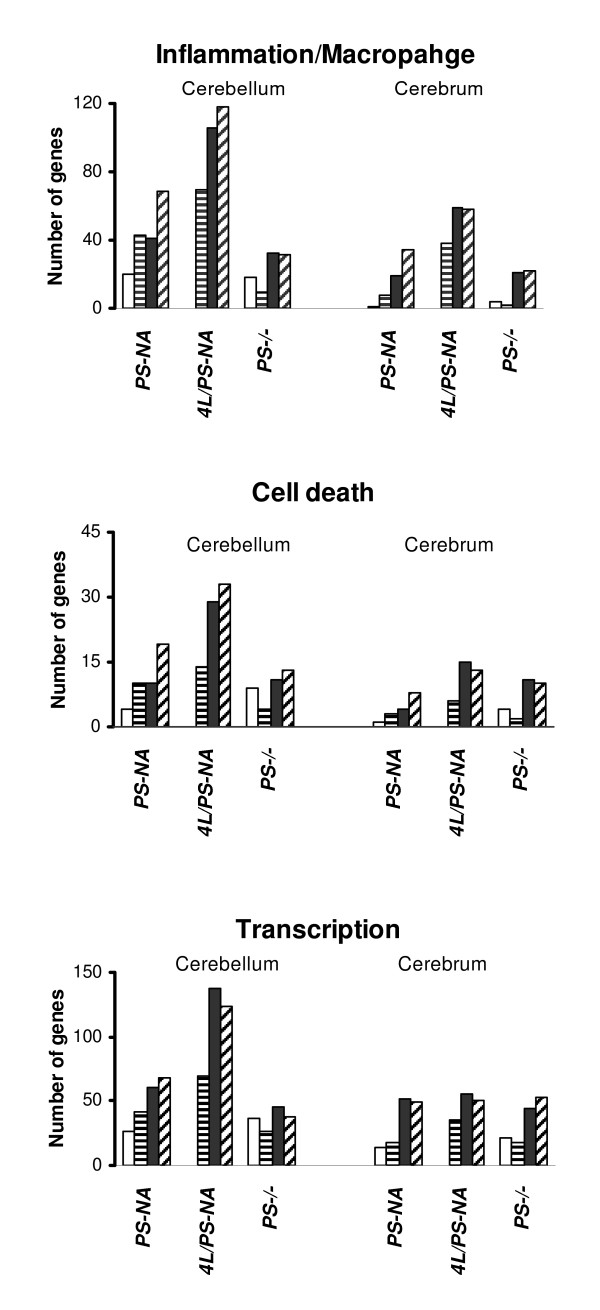
Figure 4.
Temporal expression of three functional categories ascribed to genes determined from the Gene Ontology (GO). The number of differentially expressed genes in Inflammation/Macrophage, Cell death and Transcription categories increased with age and were greater in the cerebellum than in the cerebrum. Each column represents the number of differentially expressed genes at that time point. Time points for PS-NA and 4L/PS-NA are 0 day (white columns), 4 wk (line columns), 12 wk (black columns) and 18 wk (hatched columns); for PS-/- are 0 (white columns), 10 (line columns), 20 (black columns) and 25 (hatched columns) days.

