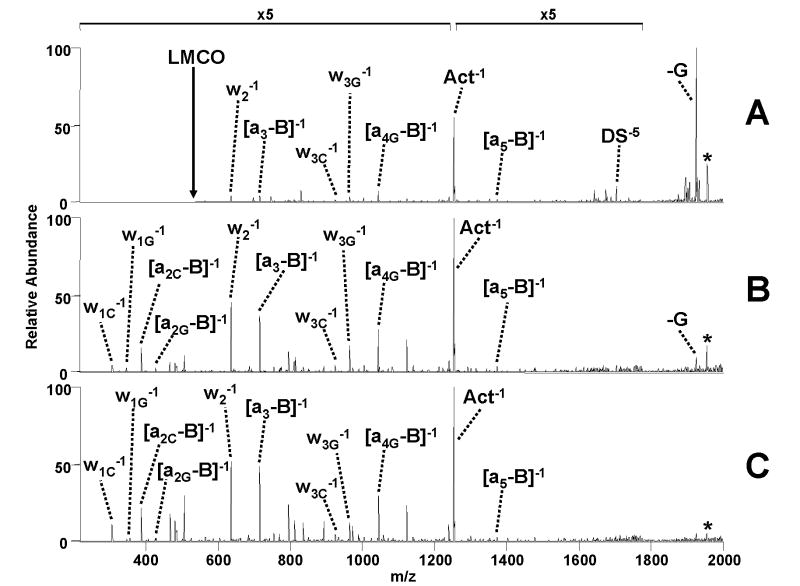
Figure 3.
ESI-MS/MS spectra of the [M - 5H]5− complex containing duplex d(GCGGGGATGGGGCG)/(CGCCCCATCCCCGC) and actinomycin by (A) CAD (0.86 V, 30 ms) (73%); (B) IRMPD (50 W, 1.5 ms) (6%); and (C) IRMPD (12.3 W, 15 ms) (4%) with the portion of uninformative base loss ions given in parenthesis.. Fragment labels include a subscript G or C if they pertain specifically to the G-rich or C-rich strand of the duplex, respectively. The magnification scale applies to all spectra within this figure. Precursor ion is denoted with a * symbol.

