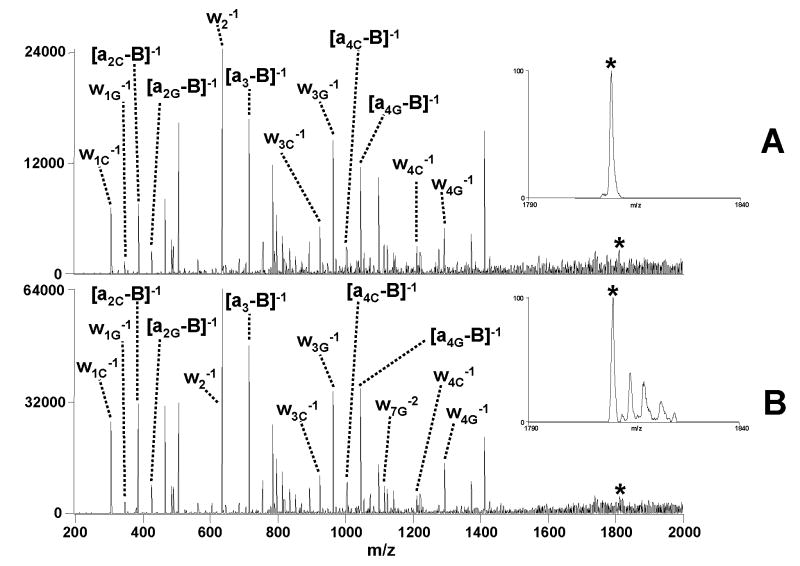
Figure 9.
Comparison of IRMPD mass spectra of (A) normal precursor isolation (50 W, 1.5ms) and (B) multi-adduct isolation (50 W, 1.5ms) for the [M - 5H]5− complex containing duplex d(GCGGGAATTGGGCG)/(CGCCCAATTCCCGC) and daunomycin. Isolation of the precursor [M - 5H]5− through the [M + 3Na - 8H]5− species are included in the multi-adduct spectrum as shown by the inset in B compared to isolation of only the deprotonated precursor for the normal isolation mode spectrum in the inset in A. Fragment labels include a subscript G or C if they specifically pertain to the G-rich or C-rich strand, respectively. An asterisk (*) symbol denotes the precursor ion selected.

