
Figure 5.
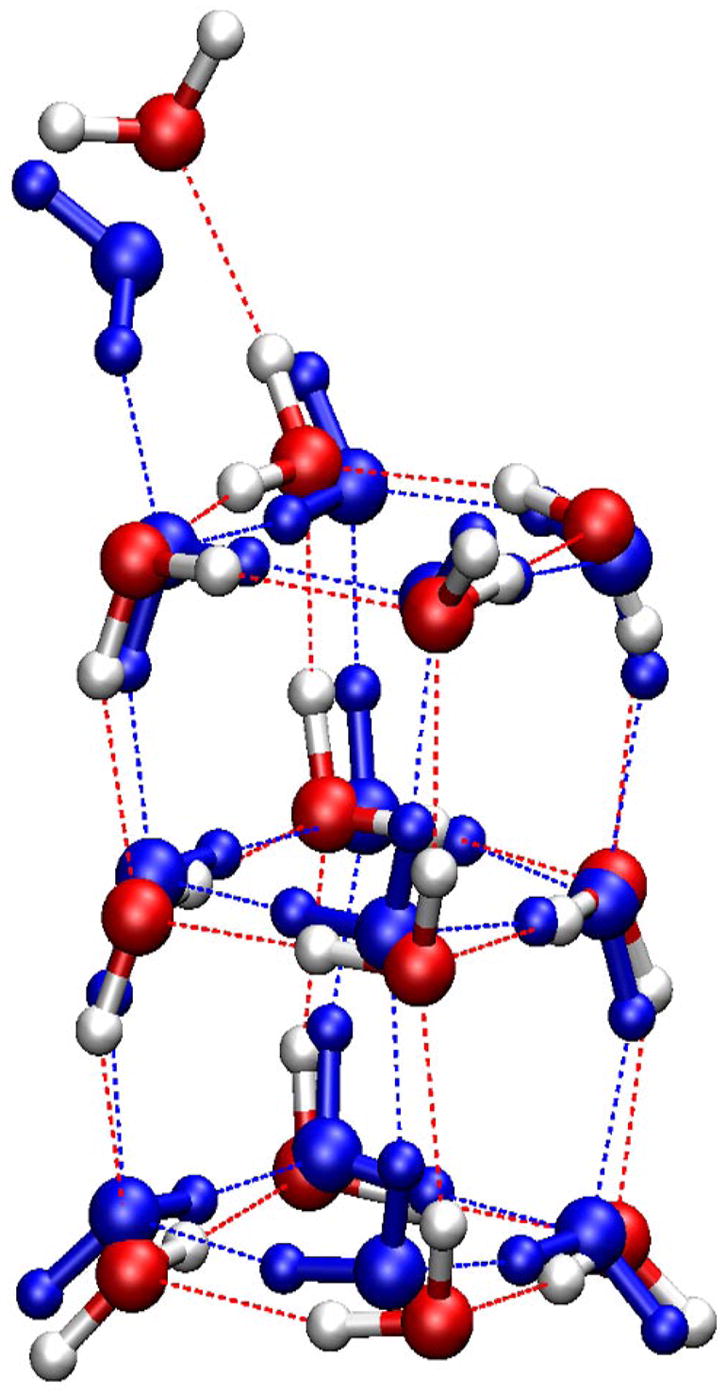
Minimized structures of the (H2O)13 cluster. CPK model in red (oxygen) and white (hydrogen) is the structure minimized from the Cambridge Cluster Database; CPK model in blue is the lowest-energy conformation identified with the SCCDFTB method.