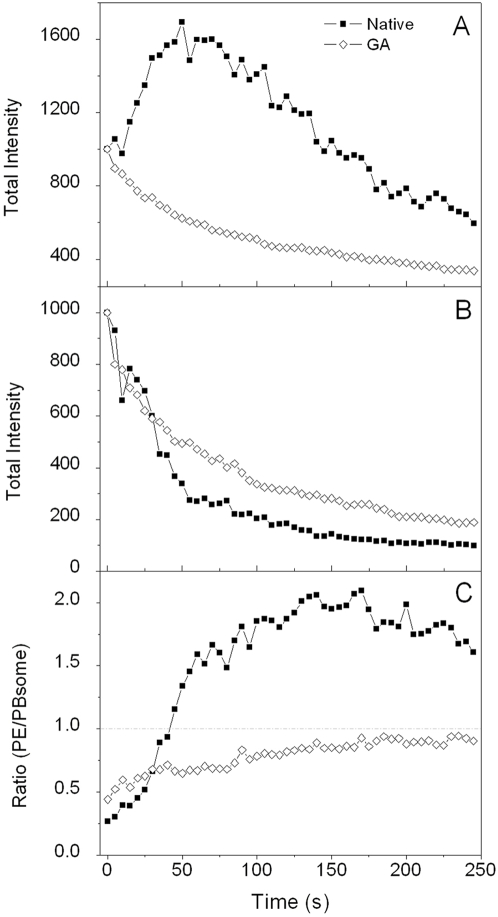
Figure 6. Fluorescence photobleaching of PBsome treated and untreated with GA under illumination power of 260 W·cm−2.
A, time course of the photobleaching of PE emission after normalization; B, time course of the photobleaching of PBsome core emission after normalization; C, time course of the ratio of fluorescence intensities of PE/PBsome core.

