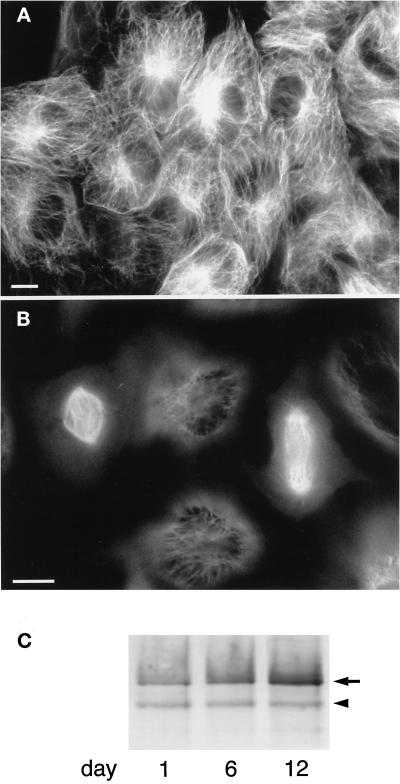
Figure 2.
Expression of GFP–XMAP4 in A6 cells. (A and B) Fluorescence images of living A6 cells expressing GFP–XMAP4. A, interphase cells; B, mitotic cells in metaphase (left) and late anaphase (right). Bars, 10 μm. (C) Immunoblotting of A6 cell extracts with anti-XMAP4 antibody. A6 cells expressing GFP–XMAP4 were extracted at 1, 6, and 12 d after they were sparsely plated (∼1% of confluence) in 100-mm dishes (cells became confluent in 12 d) and subjected to immunoblotting with anti-XMAP4 antibody. The arrowhead and arrow denote endogenous XMAP4 and GFP–XMAP4, respectively. Aliquots of ∼10 μg of protein were loaded in each lane. Because cells were not synchronized, the mobility shift (see Figure 3) was not clearly detectable.

