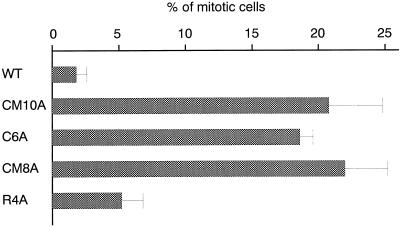
Figure 6.
BFP movement in A6 cells expressing GFP–CM10A, GFP–C6A, or GFP–CM8A. Transfectants expressing GFP–WT, GFP–CM10A, GFP–C6A, GFP–CM8A, or GFP–R4A were plated in six-well plates to form ∼50 colonies per well. After 12 d, mitotic cells were identified from phase contrast and GFP fluorescence images. Mitotic cells of three individual cell lines were scored (∼300 cells × 3), and the mean ratio of cells showing BFP movement to mitotic cells is shown for transfectants expressing each GFP–XMAP4 fusion protein. It should be noted that colony growth and proportion of mitotic cells to interphase cells were similar among the transfectants.

