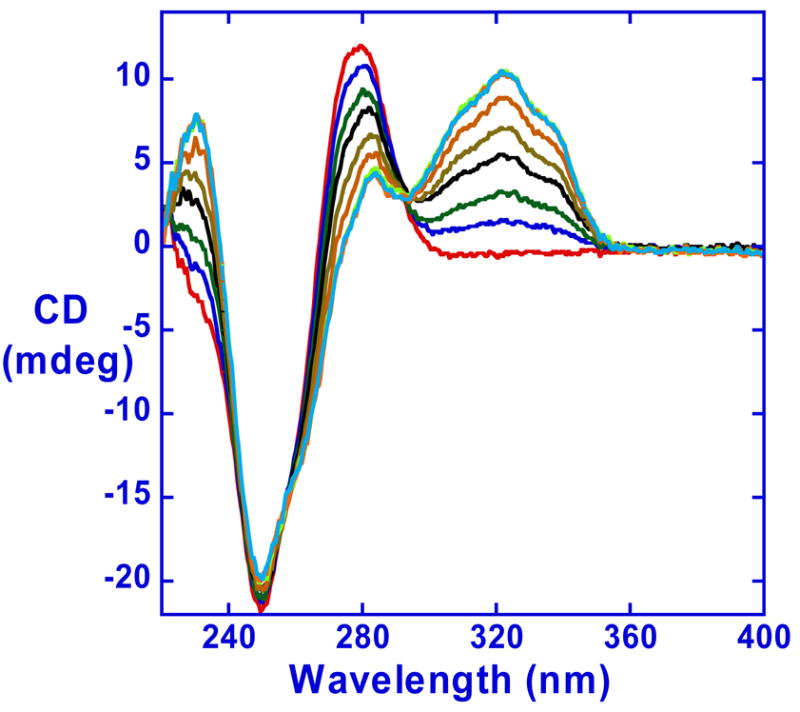
Figure 4.

Induced CD signals for RT29 with the d(CGCGAATTCGCG)2 duplex in MES 10 buffer at 25°C. Molar ratios of compound to DNA duplex are 0, 0.2, 0.4, 0.6, 0.8, 1.0, 1.2, 1.5 from the bottom to the top at the induced CD wavelength maximum near 320nm.
