
Fig. 1.
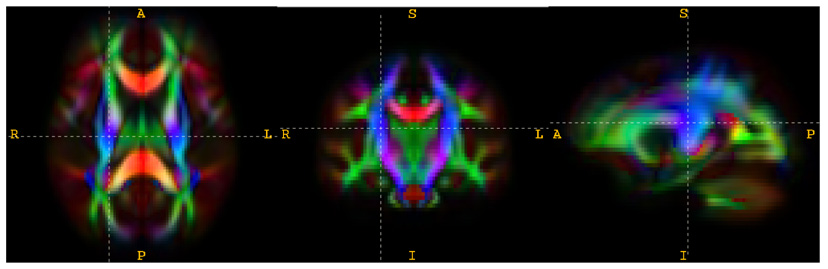
Three orthogonal views through the right CST in the white matter atlas constructed from 31 subjects (13 children with DS22q11.2 and 18 typically developing children). The standard color-coding scheme for visualizing the principal direction of diffusion is used: red for left-right, green for anterior-posterior and blue for inferior-superior. The intensity is scaled by FA.