
Fig. 12.
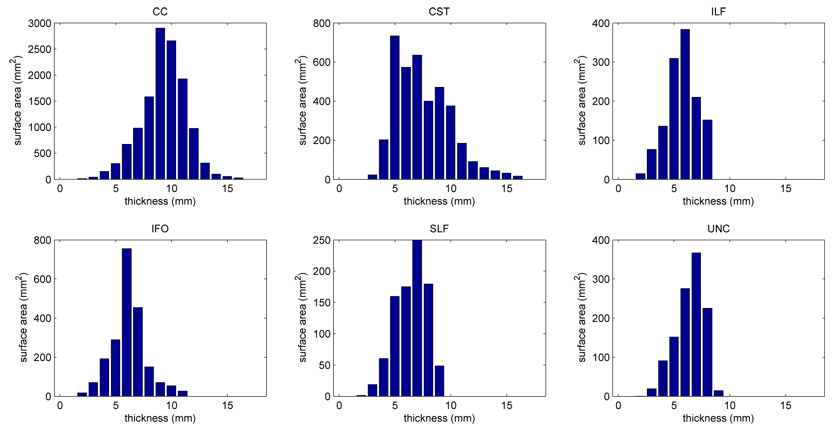
Thickness profiles of the medial models fitted to the six fasciculi in atlas space. The bars in the thickness profiles represent the surface area of the region on the medial manifold where the thickness falls within the range [i − 0.5, i + 0.5] for i = 0, 1,…, 18. Thickness is defined as the diameter of the maximal inscribed ball centered at the given point on the medial axis (i.e., thickness is twice the radius function R(u, v)).