
Fig. 13.
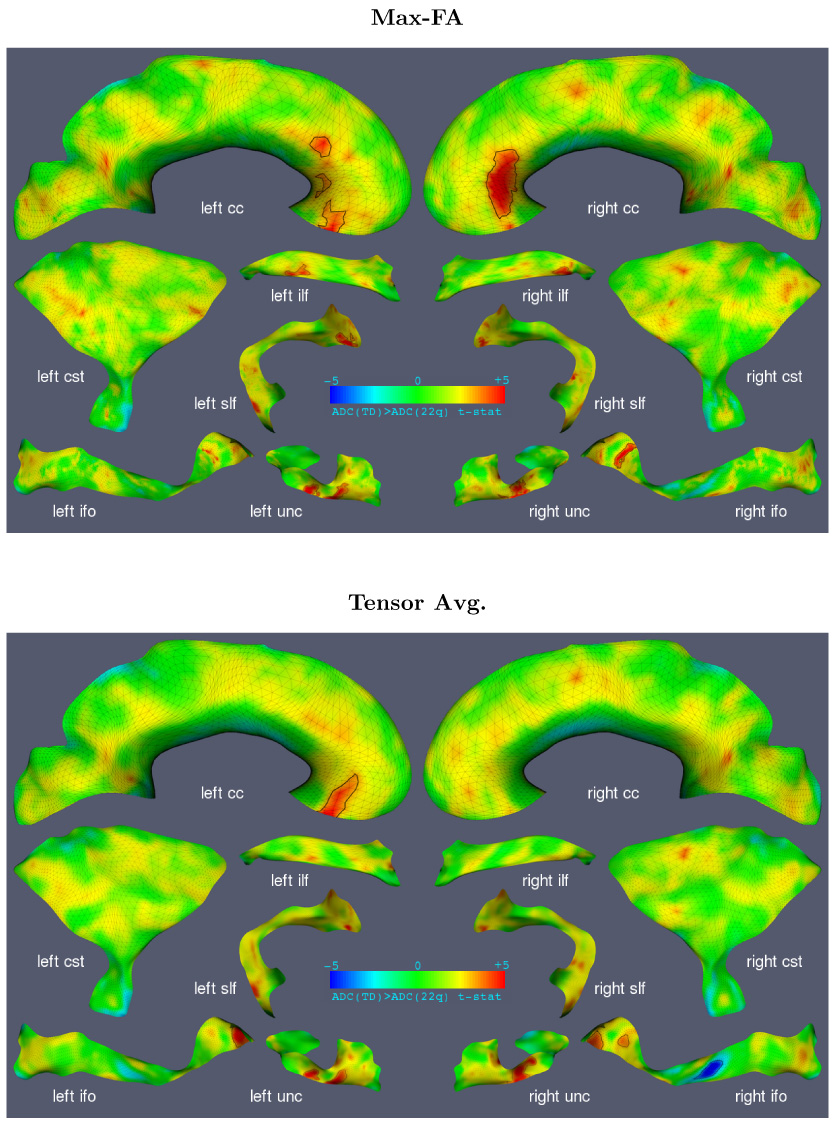
Results of cluster analysis comparing ADC between DS22q11.2 and TD, displayed in three dimensions. The medial models are colored by the t-score for the hypothesis ADC(TD) > ADC(DS22q11.2). Statistically significant clusters are marked by a black outline. Results for both dimensionality reduction strategies (Max-FA and tensor averaging) are shown.