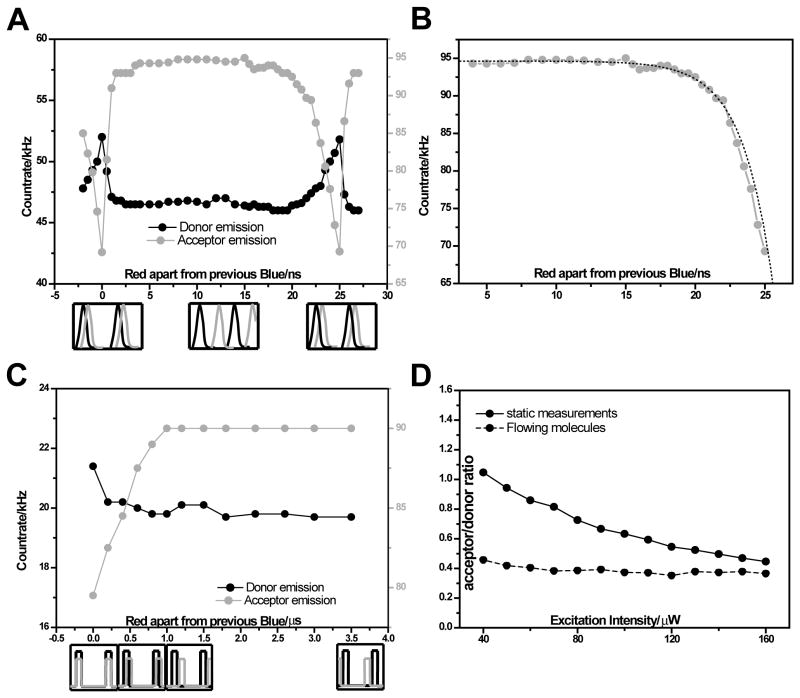
Figure 8.
(A) Ensemble donor (black) and acceptor (grey) emission rates as function of the time delay between a consecutive red and blue picosecond pulses (ns-ALEX excitation scheme). Order of pulse arrivals is shown in cartoons below the figure. (B) Acceptor emission rate as function of time delay (grey) and a fit to the model described by Eq. 3 (dashed black). (C) Donor (black) and acceptor (grey) emission rates as function of time delay between microsecond modulated CW pulse trains (dm-ALEX excitation scheme). (D) Acceptor’s emission rate normalized to the donor’s emission rate as function of excitation power in a static cell (solid) and in a continuous-flow mixing device (dashed).

