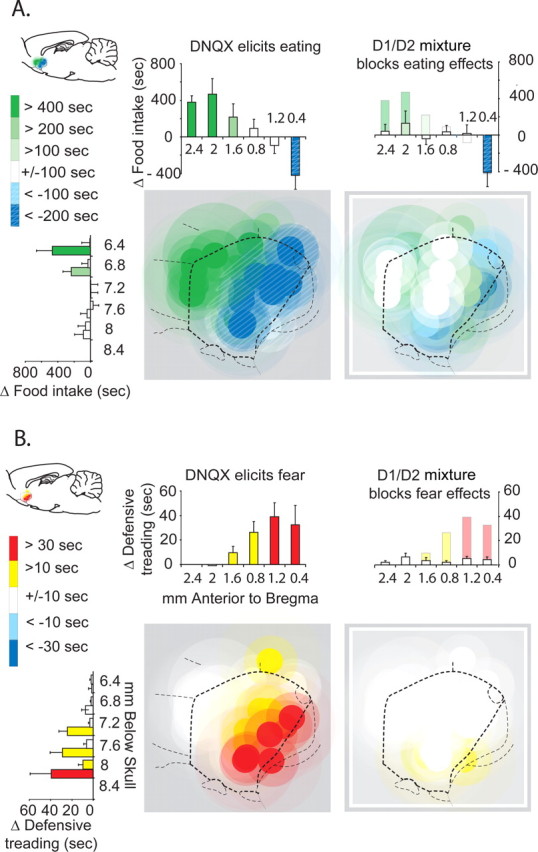
Figure 2.

A, B, Fos plume maps of appetitive eating behavior versus fearful defensive treading behavior generated by DNQX and mixture microinjections. Each plume-sized circle represents color-coded behavioral effects of DNQX or mixture at that site, compared with vehicle control levels at same site in the same rat (expressed by the color scale as a change score). Left maps show the behavioral effects of pure DNQX microinjections. Right maps show the effects of mixture microinjections (D1 antagonist plus D2 antagonist plus DNQX). A, Appetitive behavior (food intake). B, Fearful behavior (defensive treading). Histograms above or next to graphs represent rostrocaudal or dorsoventral levels showing the mean behavioral effects produced by microinjections at each level (expressed as a change score from vehicle microinjection at the same site in the same rat; +SEM). Sagittal sections are adapted from Paxinos and Watson (2004).
