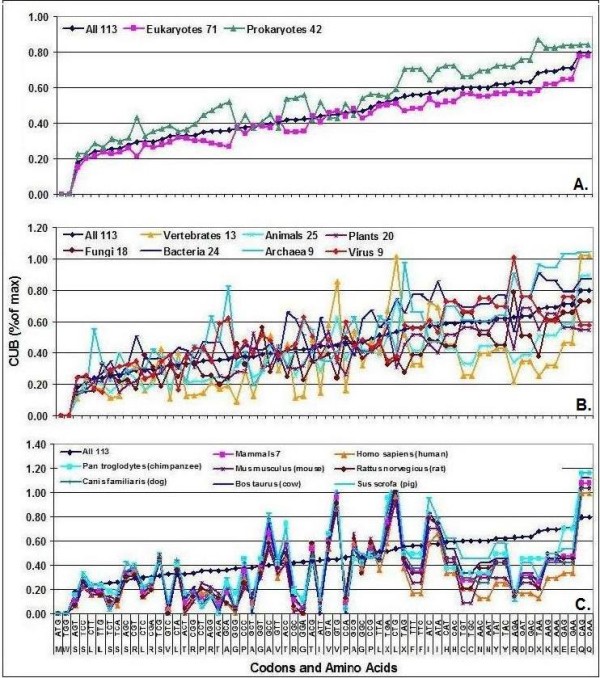
Figure 2.

CUB Comparisons. Codon Usage Biases (CUB) were calculated in 113 species and sorted into subgroups. The mean CUBs of the 64 codons in the indicated subgroups are shown. (CUBmax = 100% for the 64 codons altogether). A: superdomains, B: kingdoms, C: some mammals.
