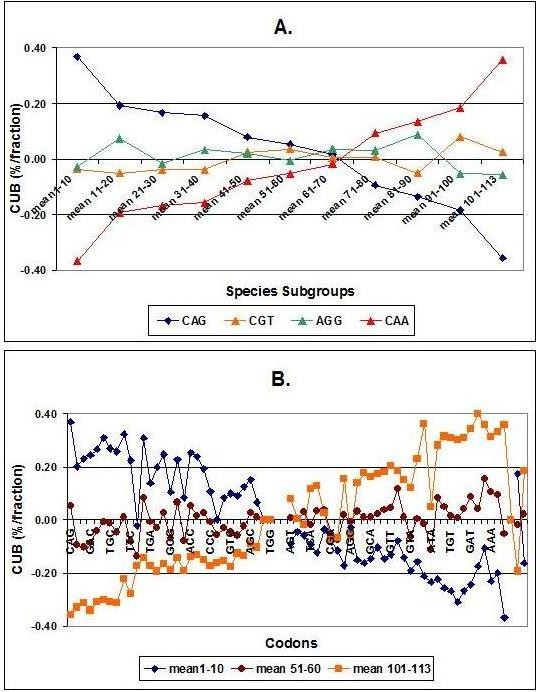
Figure 6.

Species Dependent Internal Correlation between CUBs. Codon usage biases (CUBs) from 113 species were sorted as described in the text and divided into 11 consecutive subgroups. Each symbol represents the mean of CUB values from 10 different species. The values were sorted for species subgroups (A) and for codons (B). Only some representative samples are included (4 codons of total 64 and 3 groups of different species of total 11).
