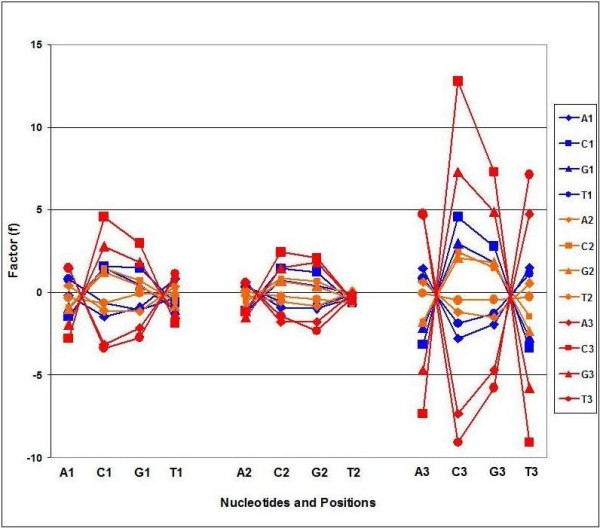
Figure 8.

CUF – Pan-Genomic Codon Correlations. Codon frequencies were collected from 113 Codon Usage Frequency Tables and the correlation coefficients (C, 64 × 64) were calculated. f = -log C. A – sign was added to indicate negative correlations. The figure shows the f values between 4 × 4 codon letter combinations in 3 × 3 codon positions. Each symbol represent the mean of f values (n = 113). f < -2 and f > 2 correspond to statistically significant correlations.
