
Figure 1.
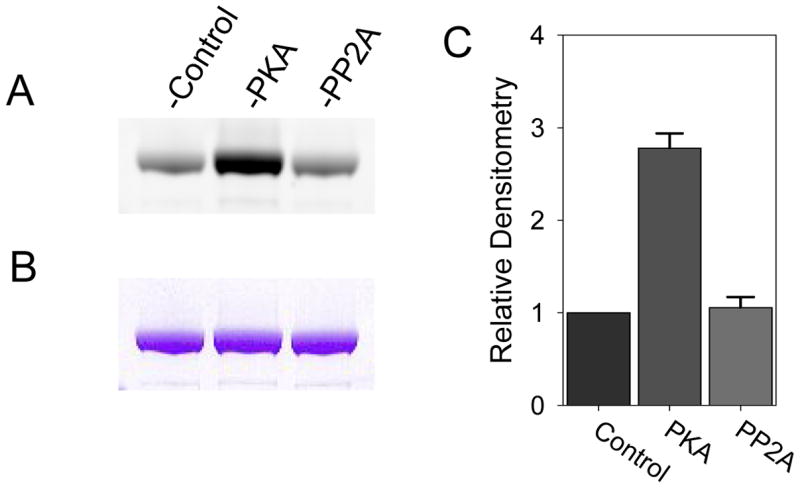
A) ProQ Diamond staining of untreated cMyBP-C (control) and cMyBP-C treated with PKA or PP2A. B) Corresponding Coomassie Blue staining demonstrating similar protein loads for the three groups. C) Densitometry of the ProQ Diamond stain demonstrating increased cMyBP-C phosphorylation with PKA treatment but no decrease in phosphorylation with PP2A treatment indicating that the cMyBP-C used in this study is largely dephosphorylated.