
Figure 1.
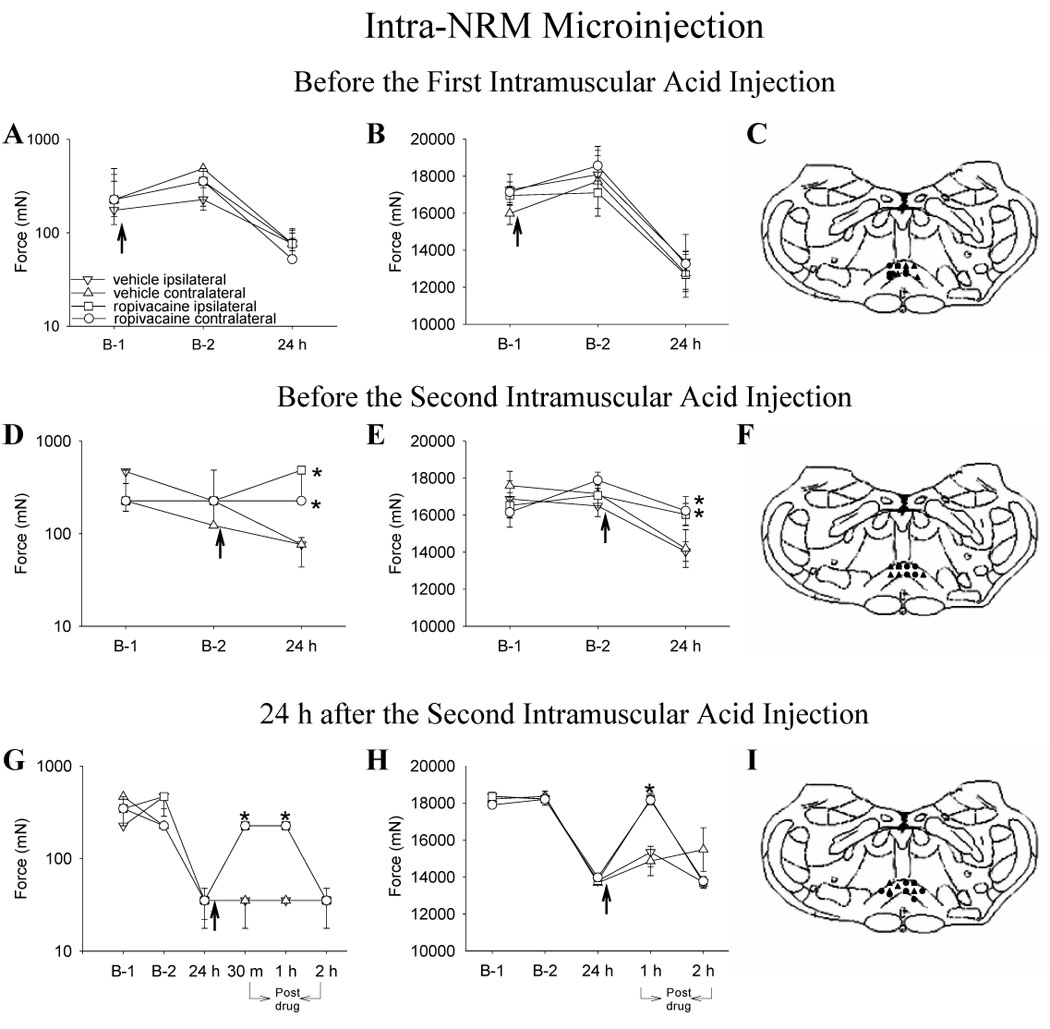
Line graphs representing mechanical withdrawal thresholds of the paw (A, D, G) and of the gastrocnemius muscle (B, E, H) from animals injected into the NRM with ropivacaine (circle) or vehicle (triangle) before injection 1 (A,B,C), before injection 2 (D,E,F) and 24 h after injection 2 (G,H,I) of acidic saline. The ipsilateral side is represented by closed symbols and the contralateral side by open symbols. The arrow represents the time when either ropivacaine or vehicle was injected into the NRM; i.e. immediately after baseline behavior testing and 15 minutes before intramuscular injection of acidic saline. A,B. Ropivacaine microinjected before first injection of acidic saline had no effect on the decreased withdrawal threshold of the paw and muscle 24 h after second injection of acidic saline. C. Sites of injection for the group receiving vehicle (triangle) or ropivaicaine (circle) before the first intramuscular acid injection. D, E. Ropivacaine microinjected before the second injection of acidic saline prevented the decrease in withdrawal thresholds of the paw and muscle. F. Sites of injection for the group receiving vehicle (triangle) or ropivacaine (circle) prior to the second intramuscular acid injection. G,H. Ropivacaine microinjected 24 h after second injection of acidic saline reversed the withdrawal threshold of the paw and muscle for 1 h. I. Sites of injection for the group receiving vehicle (triangle) or ropivacaine (circle) 24 h after the second intramuscular acid injection. The mechanical withdrawal thresholds of the paw are represented as the median with 25th and 75th percentiles and the compression withdrawal thresholds of the muscle are represented as the mean ± SEM. *, significantly greater than vehicle controls