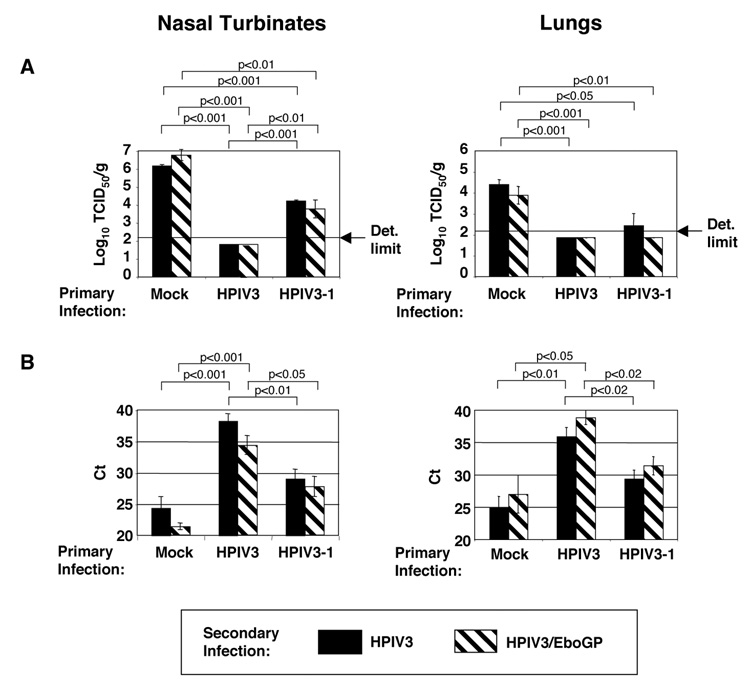
Fig. 4.
Replication of HPIV3 and HPIV3/EboGP in the nasal turbinates (left panels) and lungs (right panels) of guinea pigs that had previously been mock-infected or infected with HPIV3 or HPIV3-1, as indicated. The initial infection with HPIV3 or HPIV3-1 was at a dose of 4×10⁵ TCID50. The second infection with HPIV3 or HPIV3/EboGP was 42 days later at a dose of 4×10⁶ TCID50. The animals (four per virus per day) were sacrificed 2 days later and nasal turbinates and lungs were isolated and used (A) for virus titration and (B) for isolation of total RNA and comparison of viral RNA concentrations by quantitative RT-PCR. In part A, the limits of detection (same as in Fig. 1) are indicated with arrows. The values represent (A) mean viral titers or (B) mean threshold concentration (Ct) ± SE with the P values indicated at the top. For quantitative RT-PCR of HPIV3/EboGP RNA in lungs of HPIV3-immune animals, three rather then four animals were analyzed.

