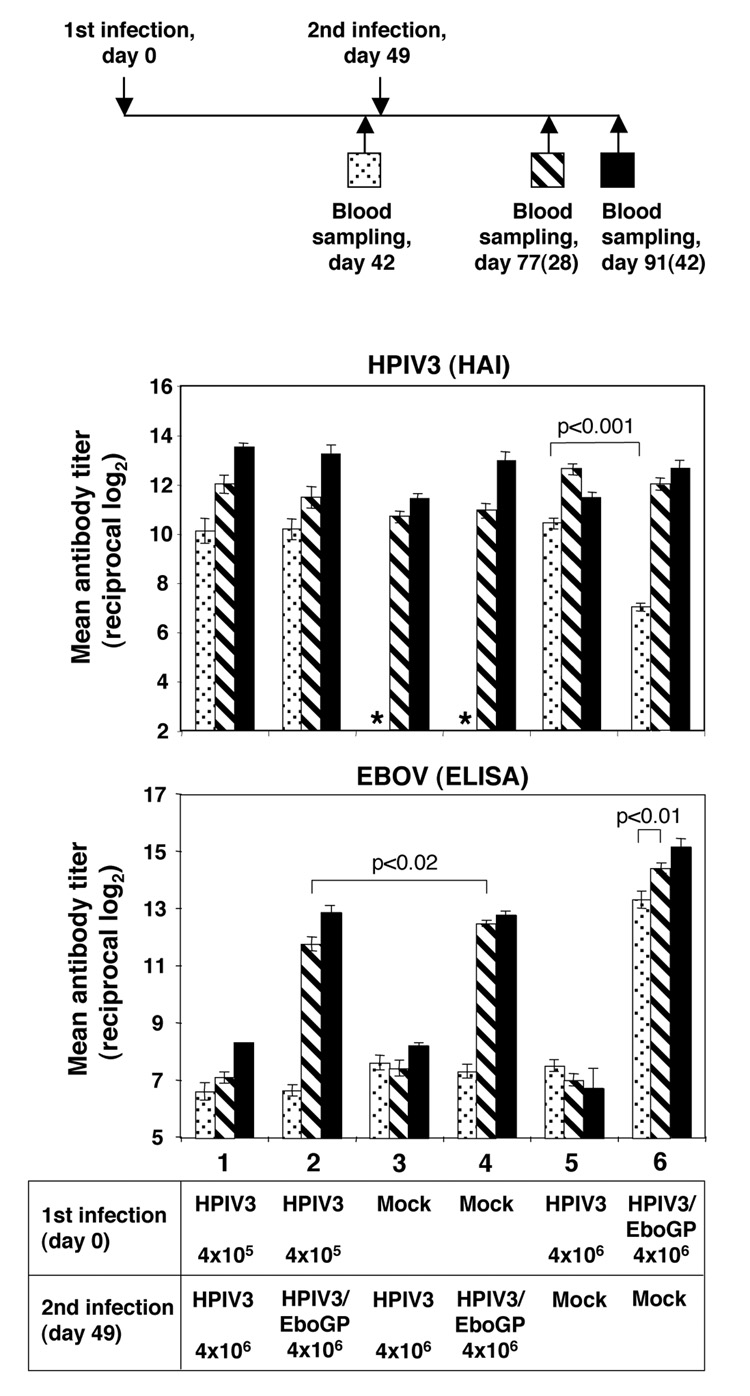
Fig. 5.
Immunogenicity of HPIV3/EboGP in guinea pigs that had previously been infected with HPIV3 or HPIV3/EboGP. Top panel: map of the experiment. The numbers in parentheses refer to the days after the second infection, and the symbols (dotted, cross-hatched, black) match those in the graphs below. Antibody responses: the anti-HPIV3 titers determined by HAI (middle panel) and the anti-EBOV titers determined by ELISA (bottom panel) from sera collected on day 42 following the first infection (dotted bars), and days 28 (cross hatched) and 42 (black) following the second infection. The antibody titers are expressed as reciprocal log2 of endpoint dilutions and shown as mean titers ± SE with the P values indicated at the top. Indicated at the bottom are: the group numbers (1 to 6) and the virus and dose used for the first and the second infections. Groups 1, 3 and 5 contained 10 animals each, and groups 2, 4 and 6 included 12 animals each. On day 42, the HPIV3-specific antibody titers in groups 3 and 4 were below the detection limit of the HAI assay (which is 2 log2), and are indicated with asterisks.

