Fig. 3.
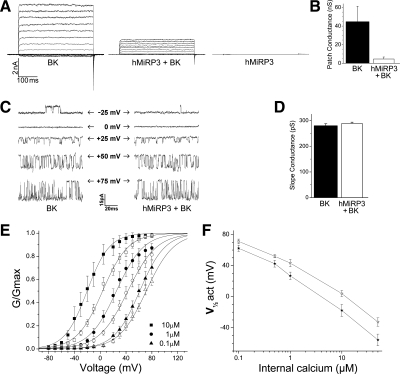
Electrophysiologic effects of MiRP3 on BK currents. Patch-clamp recordings from transfected CHO cells. A: representative macroscopic recordings of inside-out patches from cells transfected with BK and empty vector (BK), MiRP3 and BK (hMiRP3 + BK), or MiRP3 and empty vector (hMiRP3). Voltage pulses were delivered for 400 ms at 0.4 Hz from a holding potential of −60 mV. Perfusion solution contained 10 μM free Ca2+. B: mean (±SE) conductance at +80 mV is compared for patches taken from cells expressing BK or BK + MiRP3. C: representative single-channel recordings made from cells transfected with reduced BK cDNA. The internal membrane voltage for each recording is shown, and arrows indicate the closed state of the channels. D: slope conductance (±SE) is compared from single-channel recordings of BK vs. BK + MiRP3. E: conductance-voltage relationship for BK without or with MiRP3 at 3 different [Ca2+]i. Conditions were as in A except for varied [Ca2+]i as indicated by the differently shaped symbols. Filled symbols represent values (±SE) for BK alone and open symbols for MiRP3 with BK. F: half-maximal activation (V-act) over a range of internal calcium concentrations.

