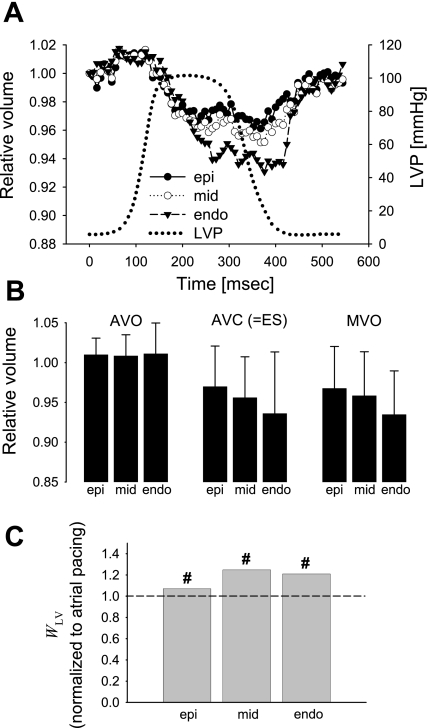
Fig. 5.
Myocardial volume change at the late activated region during LV pacing (n = 7). A: time course. Values as in Fig. 3. B: relative myocardial volume at AVO, AVC or ES, and MVO. Values as in Fig. 3. There was no significant transmural gradient at any time point [P = not significant (NS)]. C: regional work index WLV. Values are means of WLV normalized to atrial pacing at each layer. #P < 0.01 vs. early activated region.

