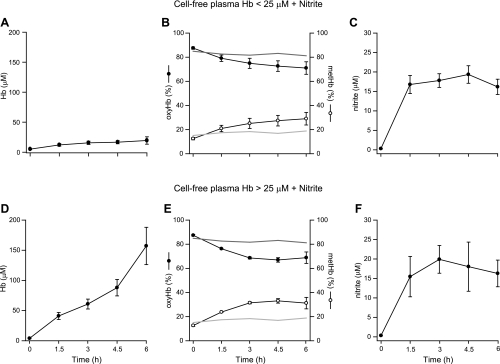
Fig. 4.
Nitrite levels and plasma Hb composition during intravascular hemolysis. A and D: intravascular hemolysis occurred at varying rates in animals receiving water and nitrite infusions. In the low-level hemolysis group (Hb < 25 μM; A), the average peak cell-free plasma Hb level was 20 μM; in the high-level hemolysis group (Hb > 25 μM; D), the average peak cell-free plasma Hb level was 142 μM. Animals receiving D5W and nitrite represent the zero-hemolysis control group with all measured cell-free plasma Hb levels <5 μM (data not shown). B and E: total plasma Hb composition in the low-level (B) and high-level (E) hemolysis groups (○, met-Hb; •, oxy-Hb). In animals receiving D5W and nitrite (zero hemolysis), 81% of the measured cell-free plasma Hb was oxy-Hb (depicted as dark gray reference lines) and 19% was met-Hb (depicted as light gray reference lines). With increasing Hb concentrations, the rate of met-Hb formation increased from 0 to 3 h (P = 0.0001), producing higher levels of met-Hb from 3 to 6 h (P = 0.0001) in animals with higher levels of hemolysis compared with animals with lower levels of hemolysis. These results can be explained by the fact that the overall reactions of nitrite with oxy- and deoxy-Hb are second order during their lag phases such that increasing Hb concentrations lead to increasing rates of reaction. C and F: in both the low-level (C) and high-level (F) hemolysis groups, plasma nitrite levels were similar and were maintained within a range of 16–21 μM throughout the 6-h experiment.

