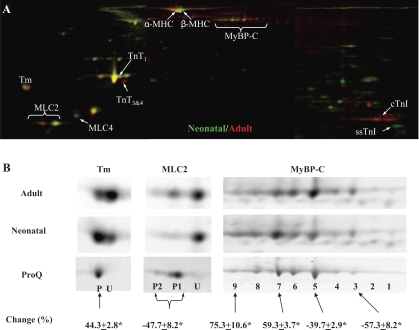
Fig. 1.
Two-dimensional (2-D) gel analysis of neonatal and adult rat myofilament proteins. Sarcomeric proteins extracted from neonatal (n = 6) and adult (n = 6) rat hearts were labeled with Cy3 (green) or Cy5 (red). A pool was created by mixing equal amount of all 12 samples, and this pool was labeled with Cy2. Then, 15 μg of differentially Cydye-labeled proteins were combined and separated by 2-D electrophoresis, with the isoelectric focusing (IEF) performed with 24-cm, pI range 3–11 IPG (immobilized pH gradient) strips (GE Healthcare). At the end of the IEF, IPG strips were cut into 3 pieces of 7 cm in length, and proteins were separated by molecular weight with three 4–12% bis-Tris gels (Invitrogen). A: representative stitched Cy3/Cy5 image overlay (pI 3–11) is shown. Consistently changed protein spots are indicated. MHC, myosin heavy chain; MyBP-C, myosin-binding protein C; Tm, tropomyosin; MLC, myosin light chain; TnT, troponin T; cTnI, cardiac isoform of troponin I (TnI); ssTnI, slow skeletal isoform of TnI. B: separate views of Tm, MLC2, and MyBP-C are shown. Additional 2-D gels were run using Cy2-labeled proteins (15 μg/gel) and stained with Diamond ProQ for the codetection of total protein (Cy2) and phosphoprotein (ProQ). ProQ staining of adult Tm, MLC2, and MyBP-C spots is also shown in B. Cy2 images (not shown) were used to align ProQ images with difference gel electrophoresis (DIGE) images. P, phosphorylated spot; U, unphosphorylated spot. Spot volume changes (in %) from adult to neonatal samples were calculated using DIGE data and are expressed as means ± SE. *P < 0.05.

