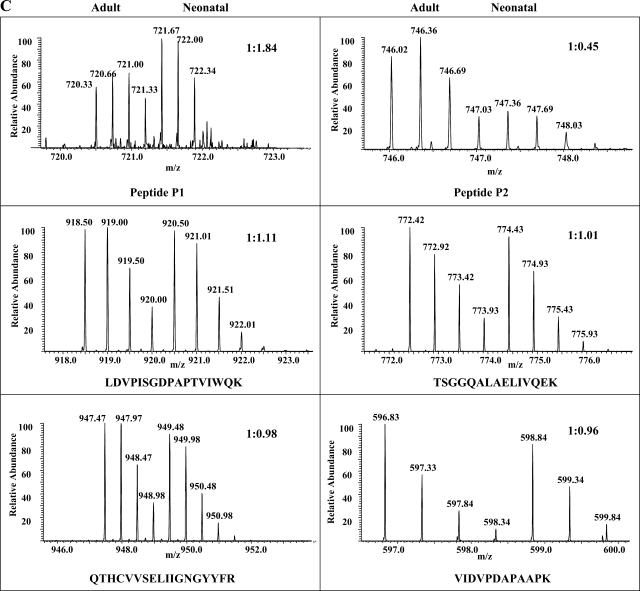
Fig. 3.
Identification and quantification of MyBP-C phosphorylation at Ser295 and Ser320. Two phosphopeptides, P1 and P2, identified by PSD-MALDI analysis were subjected to linear ion trap-Fourier transform (LTQ-FT) analysis, and they contained phospho-Ser295 and phospho-Ser320, respectively. A: electron capture dissociation (ECD)-MS2 spectrum of phosphopeptide P1 is shown along with its amino acid sequence. Matched ions are indicated. B: collision-induced dissociation (CID)-MS2 spectrum of peptide P2. C: FT full scans of P1 and P2 peptides as well as selected unphosphorylated peptides present in the TiO2-unbound fractions. The determined 16O-to-18O ratios and peptide sequences are indicated.


