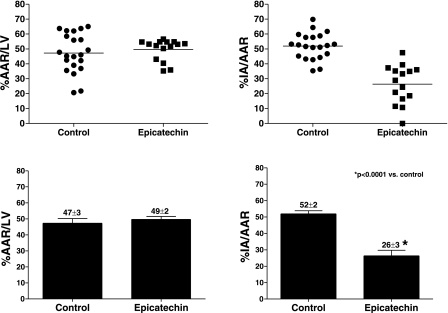
Fig. 1.
Infarct area (IA) as a function of area at risk (AAR) in ischemia-reperfusion (I/R) rats subjected to 10 days vehicle or epicatechin treatment and 48 h reperfusion. Infarct size was determined by staining hearts with trypan blue and triphenyltetrazolium chloride. A: dispersion plot of the AAR in I/R (n = 21) and I/R +10 days epicatechin (n = 15) in rats subjected to 48 h reperfusion. B: bar graphs of the AAR. C: dispersion plot of the IA in I/R (n = 21), and I/R + 2 days epicatechin (n = 15) subjected to 48 h reperfusion. D: bar graphs of the IA. Values are means ± SE.

