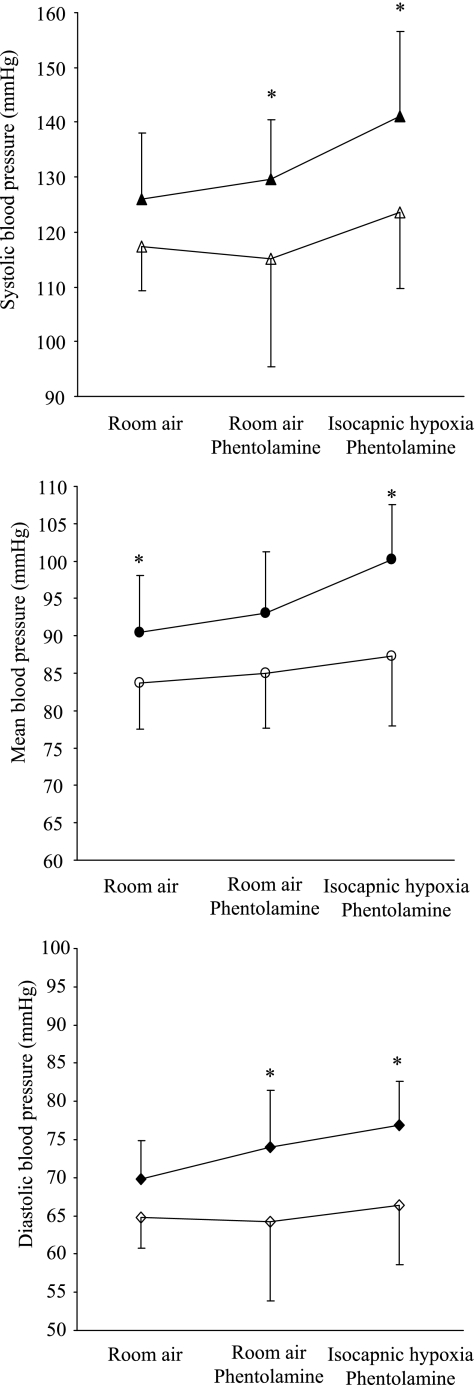
Fig. 2.
Blood pressure changes after 2-wk exposure. Open symbols, before recurrent hypoxia; closed symbols, after 2 wk of recurrent hypoxia. Significant differences were found between measurement for systolic, mean, and diastolic blood pressure (ANOVA P < 0.001 for all). *Significant differences in postexposure compared with preexposure values in post hoc analysis by Bonferroni test. Although across testing conditions arterial blood pressure tended to increase during isocapnic hypoxia, this change did not reach statistical significance.

