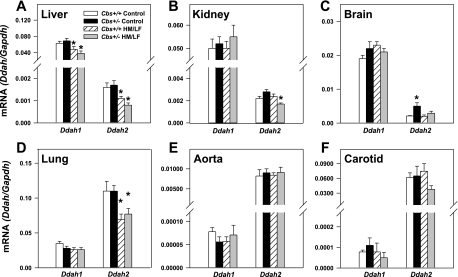
Fig. 6.
Levels of Ddah1 and Ddah2 mRNA in the liver (A), kidney (B), brain (C), lung (D), aorta (E), and carotid artery (F) of Cbs+/+ and Cbs+/− mice fed either the control or HM/LF diet (n = 6–10 in each group). Levels are normalized to levels of Gapdh mRNA. Values are means ± SE. *P < 0.05 vs. mice of the same genotype fed the control diet.

